10 Feb 2025
What is the Net Promoter Score (NPS)? How to Calculate & Interpret
Prashant Sharma
How likely are you to recommend us to a friend? That simple question is at the heart of Net Promoter Score (NPS), a powerful measure of customer loyalty.
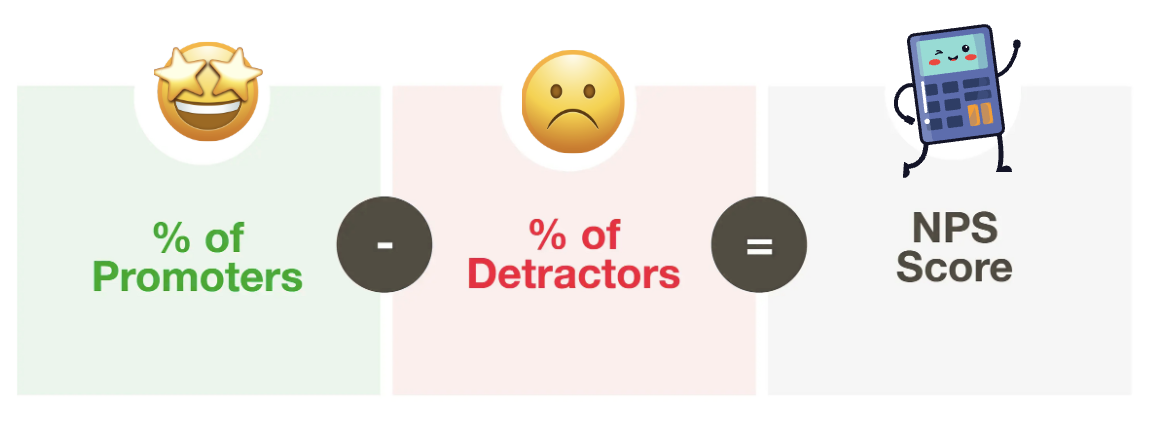
Here's how it works: Customers rate you from 0 to 10, with responses grouped into Promoters (9 to 10), Passives (7 to 8), and Detractors (0 to 6). Your NPS score is calculated by subtracting the percentage of Detractors from Promoters, giving you a clear picture of customer satisfaction. Companies use these insights to improve their offerings and build stronger customer relationships, turning more customers into loyal advocates.
NPS helps businesses focus on what matters: getting more happy customers. It's a simple, trackable number showing if you're winning people or turning them off. Companies can rally their teams around improving this score, and easily see if they're making progress over time.

Why NPS is important?
Net Promoter Score isn't just a metric - it's a window into your future growth. When customers give you high NPS scores (especially compared to your competitors), it's a sign of something powerful happening. These aren't just satisfied customers - they're becoming your unofficial marketing team. They recommend you to friends, defend your brand online, and create the kind of authentic word-of-mouth that paid advertising can't buy. This creates a positive feedback loop where happy customers bring in more customers, who themselves become promoters. It's like having a growth engine that runs itself.
NPS gives you a high-level view of customer satisfaction, but the number alone doesn't tell the whole story. You need more context than just a score to understand what's happening with your customers. The overall NPS system is important because it allows businesses to:
- Ask customers why they gave their specific rating as part of your NPS survey. This simple follow-up helps businesses of all sizes understand their strengths and identify areas for improvement
- Track and quantify a score over time, creating internal benchmark metrics
- Rally all employees around one mission-critical objective: earning more enthusiastic customers

How to calculate NPS?
NPS is calculated by taking the percentage of your "promoters" (those who rate you 9-10) and subtracting the percentage of your "detractors" (those who rate you 0-6). The people who give you a 7-8 don't factor into the final score, though they're tracked as "passives."
Net Promoter Score scale: detractors, passives, promoters
In the Net Promoter System, we group customers into three simple categories based on their answer to one key question: "How likely are you to recommend us?"
These groups are:
- Promoters: Your enthusiastic fans who love your product or service
- Passives: Satisfied but unenthusiastic customers
- Detractors: Unhappy customers who might warn others away
This straightforward system helps companies understand customer loyalty at a glance and identify who's likely to spread positive word-of-mouth versus who might damage your reputation.
How to Analyze Net Promoter Score
Net Promoter Score (NPS) is always a number between -100 and 100. A negative score means a company has more detractors than promoters, while a positive score means the opposite.
NPS benchmarks can vary widely by industry. For example, a U.S. study by the Temkin Group found that average NPS scores ranged from 0 (for internet and TV service providers) to 39 (for auto dealers). Another study reported averages from -1 (internet service providers) to 65 (department and specialty stores).
Understanding industry averages provides valuable insight into how competitors are performing and helps define what qualifies as a 'good' or 'bad' score.
What is a good NPS Score?
The Net Promoter Score (NPS) ranges from -100 to +100, and any score above zero is considered a positive sign because it means a company has more enthusiastic customers ("promoters") than unhappy ones ("detractors").
While top-performing companies often aim for an NPS of 70 or higher, you might be surprised to learn that even some of the world's biggest brands fall short of this mark.
For example, in 2018, Amazon scored 54, Google landed at 53, and Apple trailed with 49. A flawless score of 100 would mean every customer surveyed would recommend the company—a feat no business has ever achieved, no matter how beloved.
What is a bad NPS score?
Here's a more human-friendly take:
If a company's Net Promoter Score (NPS) drops below zero, it means there are more unhappy customers (detractors) than loyal fans (promoters). That's when industry benchmarks come into play. Let's say a business scores a 3—on its own, that might sound awful. But if competitors in the same industry average a -10, that -3 suddenly seems less dire.
Of course, even if the bar is low for an industry, a negative NPS is still a red flag. It's a wake-up call to tackle customer frustrations, fix what's broken, and turn critics into cheerleaders. After all, no business wants to stay in the negatives when there's room to grow loyalty—and boost that score.
How to Run Effective Surveys and Collect NPS Feedback?
If you want to measure and track NPS for your business, start by running an NPS survey to gather customer feedback. You can do this in two ways: either by asking for feedback immediately after an interaction or by reaching out later to get their thoughts on the overall experience.
-
Website Survey
Pop-up surveys on your website help you gather customer feedback while they're still engaged. You can place an NPS survey on key conversion pages—like the "thank you" page after purchase—or use an exit-intent survey just before someone leaves your site.
To run the survey, start with the classic NPS question:
"On a scale of 0 to 10, how likely are you to recommend [company] to a friend or colleague?"For deeper insights, follow up with open-ended questions:
- If they choose 0-8 (detractors/passives), acknowledge their experience and ask, "What can we do to improve your score?"
- If they choose 9 or 10 (promoters), show appreciation and ask, "What's the main reason for your score?"
You can even add an optional third question inviting them to share ideas on how you can improve.
-
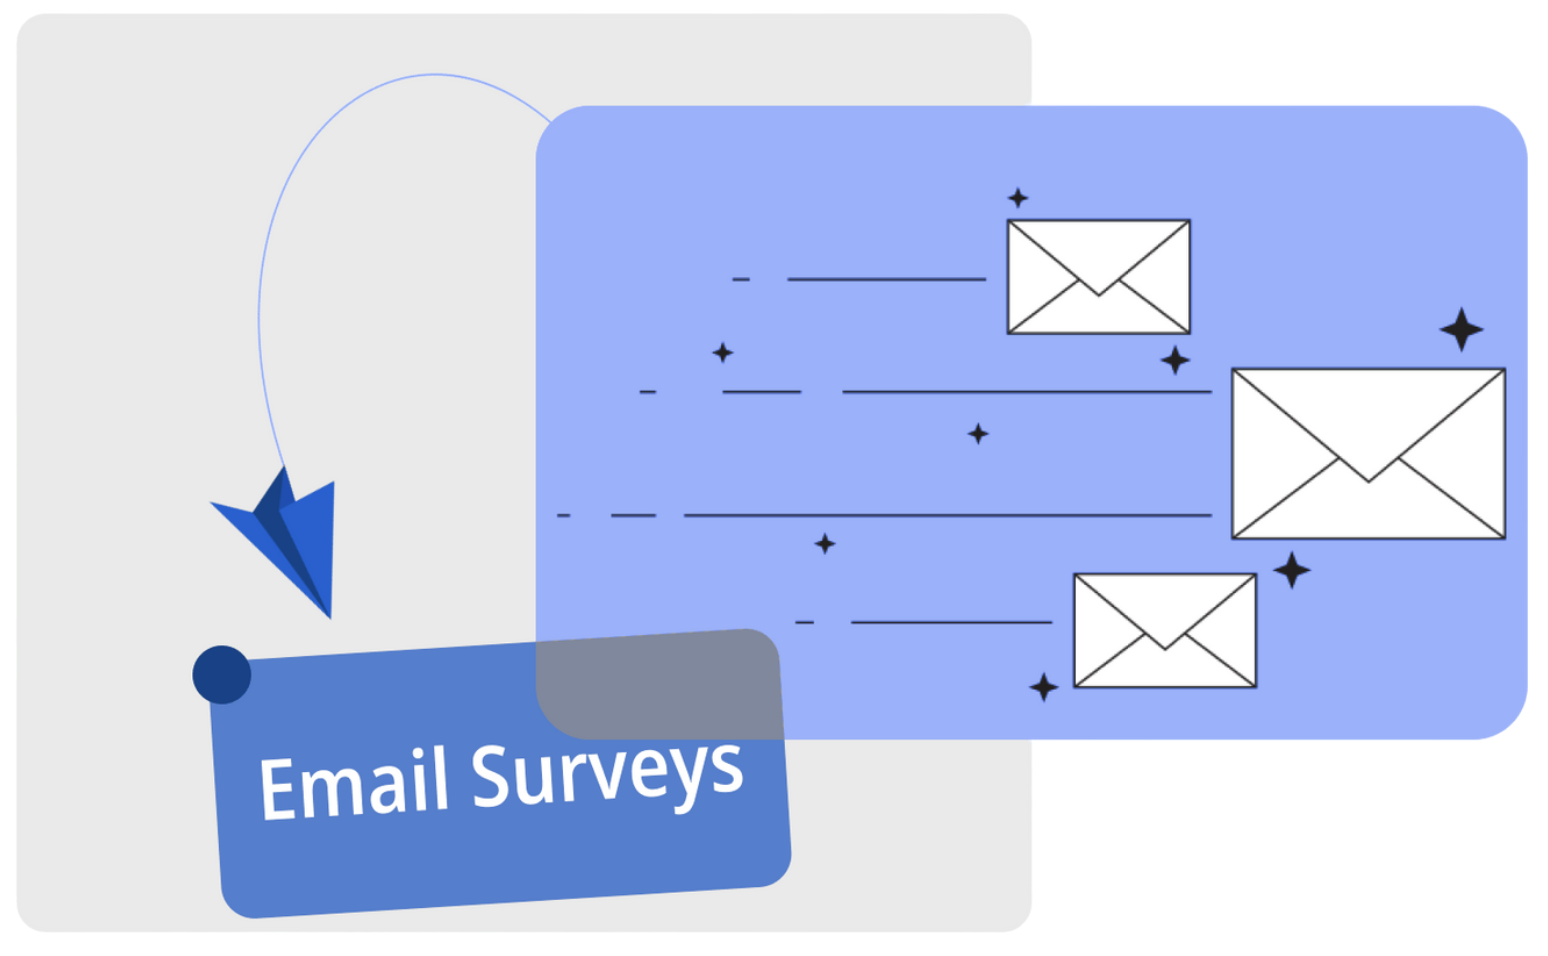
Email Survey
Instead of hitting customers with a website pop-up, try sending them an email survey after they've made a purchase or had a meaningful interaction with your business. Sure, email surveys require a bit more effort—they have to open the email, click the link, land on a survey page, and then fill it out. And yes, you won't get instant results like you might with a pop-up.
But here's the upside: Giving people space (like 15–30 days) to actually use your product or service means their feedback could be way more thoughtful.
They've had time to form real opinions, so when they answer "Would you recommend us?" their response might feel truer to their experience. It's a trade-off—patience for deeper insights!
How to read your NPS survey results?
NPS doesn't just measure how likely customers are to take action based on their experience—it's also a strong indicator of future business growth or decline. In simple terms, it helps you spot potential issues both at an individual customer level and across your entire customer base.
The Temkin Group study mentioned earlier also found a strong link between NPS and customer experience. In the U.S., companies that lead in customer experience tend to have an NPS that's, on average, 21 points higher than those that lag.
Once you've run your NPS survey and gathered data, here's how to interpret your results:
-
Analyze Data Segment
Your company's Net Promoter Scores® (NPS) can differ across various customer segments—like age groups, gender, long-term vs. new customers, or even high-spending customers. If you're just starting with NPS, don't worry about diving too deep right away. Any data you gather now will help you build a solid foundation.
As you get more experienced, you can take your NPS analysis to the next level by introducing segmentation models. This allows you to fine-tune your strategy and tailor your approach to different customer groups for even better insights.
-
Track your performance over time
Since NPS is a real-time metric, you could check it daily if you wanted—but its real value comes from tracking trends over time. The real insights emerge when you start noticing patterns and fluctuations.
Getting a high response rate for every NPS survey isn't always easy. But when you do get a strong number of responses, use those as benchmarks for future improvements. Over time, as you see shifts in your NPS, you can dig deeper to understand what's driving the changes—which brings us to the next point
-
Complete the cycle
NPS is not just about the score—it's the insights you gain from the follow-up questions in the survey (and even beyond) that hold the real value.
Having a clear approach to interpreting your NPS score is essential. It's equally important to close the loop with customers by digging deeper into the context and reasons behind their ratings. Through methods like one-on-one interviews or follow-up sessions, you can pinpoint specific issues, identify areas for improvement, and truly align your efforts with what matters most to your customers. This approach ensures you're driving change in a customer-centric way.

NPS in a Nutshell
The Net Promoter Score® (NPS) is a metric that helps businesses gauge the loyalty of their customer base. It's scored on a scale from -100 to +100, based on responses to the question: "How likely are you to recommend this company to a friend or colleague?"
To drive growth, you need a loyal customer base – those 'promoters' who not only love your product but are eager to spread the word and send referrals your way. In an NPS survey, these promoters are the ones who score you a 9 or 10.
While NPS provides a solid number to track and compare your business's performance, its true power lies in the follow-up questions. When customers provide their scores, you can ask them things like, "What's the main reason for your score?", "What can we do to improve your experience?", and "What could we do to WOW you?" These answers give you invaluable insights into how to better serve both your current customers and attract new ones.
Remember, customer satisfaction is the secret to keeping your customers happy and loyal.
(Note: Net Promoter, Net Promoter System, Net Promoter Score, NPS, and the related emoticons are trademarks of Bain & Company, Inc., Fred Reichheld, and Satmetrix Systems, Inc.)